Behavioral metrics are quantitative measurements that track how users interact with a website, app, or digital product. They go beyond simple traffic numbers to reveal what users actually do: where they click, how long they stay, where they drop off, and what actions they take before converting. These metrics help product and marketing teams make smarter, evidence-based decisions.
What Are Behavioral Metrics?
Behavioral metrics are data points that measure how people interact with your digital product, website, or application. They answer a deceptively simple but strategically powerful question: what are users actually doing?
Unlike traffic metrics that tell you how many people arrived, behavioral metrics tell you what happened after they got there. Did they read the entire page or leave after 10 seconds? Did they click your call-to-action button or scroll right past it? Did they complete the checkout flow or abandon their cart on step three?
These questions matter enormously. A site that attracts 100,000 monthly visitors but converts none of them is underperforming one that attracts 10,000 visitors with a 5% conversion rate. Behavioral metrics expose this reality.
User behavior analytics sits at the intersection of data science and UX strategy. When you understand user behavior at scale, you stop guessing and start making decisions grounded in evidence.
Why Behavioral Metrics Matter More Than Vanity Metrics
Most teams are comfortable reporting on pageviews, sessions, and follower counts. These are vanity metrics: they look impressive in a dashboard but reveal very little about whether your product is actually working.
Behavioral data metrics go deeper. They reveal friction points, uncover drop-off patterns, and highlight which content or features drive real engagement. Here is why this distinction matters strategically:
- Vanity metrics tell you the size of your audience. Behavioral metrics tell you what your audience thinks of your product.
- When a SaaS company sees that 60% of new users never complete onboarding, that is a behavioral signal. When an e-commerce brand notices that mobile users abandon checkout at the payment step three times more often than desktop users, that is a behavioral signal. Both point to specific, fixable problems that traffic numbers alone would never reveal.
Website behavioral analytics turns passive data into strategic intelligence. That is its core value.
The Core Categories of Behavioral Metrics
Behavioral metrics fall into several distinct categories, each serving a different strategic purpose.
Engagement Metrics
These measure how deeply users interact with your content or product:
- Session duration: How long a user spends in a single visit
- Pages per session: How many pages a user views before leaving
- Scroll depth: How far down a page users scroll (are they reading the full article or leaving at the fold?)
- Interaction rate: The percentage of users who click, tap, or engage with specific elements
Retention and Loyalty Metrics
These reveal whether users come back:
- Return visitor rate: The proportion of users who visit more than once
- Churn rate: The percentage of users who stop using your product over a given period
- DAU/MAU ratio (Stickiness): Daily active users divided by monthly active users; a higher ratio indicates a habit-forming product
Conversion Behavioral Metrics
These track the actions that generate business value:
- Goal completion rate: How often users complete a defined action (sign-up, purchase, download)
- Funnel drop-off rate: Where users abandon a multi-step process
- Click-through rate (CTR): The percentage of users who click a link or button after seeing it
- Micro-conversion rate: Smaller actions (like adding to a wishlist or saving a post) that signal purchase or conversion intent
Navigation and Flow Metrics
These reveal how users move through your product:
- Entry and exit pages: Where users begin and end their sessions
- User flow paths: The sequence of pages or screens users visit
- Dead-click rate: How often users click on non-interactive elements, a sign of UX confusion
- Rage-click rate: Repeated rapid clicks on the same element, indicating frustration
How to Use Behavioral Data Strategically
Collecting behavioral data is only the first step. The strategic value comes from acting on it systematically.
Step 1: Define Your Behavioral Goals First
Before you instrument a single event, decide what behaviors you are optimizing for. Are you trying to increase product activation? Reduce churn? Improve checkout conversion? Each objective points to a different set of behavioral metrics. Starting with data collection before goals leads to metric overload and analysis paralysis.
Step 2: Map Your Critical User Journeys
Identify the three to five paths through your product that matter most to your business. For a SaaS tool, this might be: sign up, complete onboarding, use a core feature, invite a team member, upgrade to paid. Map each step and instrument behavioral tracking at every transition point.
Step 3: Identify Drop-Off and Friction Hotspots
Use funnel analysis to pinpoint exactly where users abandon your most important flows. A 40% drop-off between steps two and three of onboarding is not just a data point; it is a prioritized design problem. Pair funnel data with session recordings to watch real users hit that friction point.
Step 4: Form Hypotheses and Run Experiments
Behavioral data is most powerful when it informs A/B testing. If scroll depth data shows that 70% of users never reach your CTA because it sits below a long text block, test a version where the CTA appears earlier. Measure whether that change improves conversion rate. This is the core loop of data-driven product improvement.
Step 5: Build a Behavioral Reporting Cadence
Raw data only creates value when reviewed consistently. Build a weekly or bi-weekly review process where your team examines behavioral metrics against targets. Look for shifts: what improved, what regressed, and what new anomalies appeared.
Real-World Examples of Behavioral
E-commerce brand reduces cart abandonment by 23%
A mid-sized online retailer noticed through funnel analysis that mobile users were dropping off at the shipping cost step during checkout at a rate nearly three times higher than desktop users. Session recordings revealed that users were surprised by shipping costs appearing late in the flow. The team tested showing estimated shipping costs earlier in the product page experience. Cart abandonment on mobile dropped by 23% within six weeks.
SaaS company improves activation rate by reordering onboarding steps
A project management software company tracked feature adoption rate during the first 72 hours after sign-up. Data showed that users who completed a specific action (creating their first task and assigning it to a team member) had a 4x higher 90-day retention rate. The team restructured onboarding to guide all new users toward that action first. Activation rate improved by 31%.
Content publisher uses scroll depth to improve article revenue
A media company found that premium subscription CTAs placed at the bottom of articles were rarely seen: scroll depth data showed only 22% of readers reached that section. By placing a CTA at the 50% scroll point and testing its placement and copy, they increased subscription clicks from content by 47%.
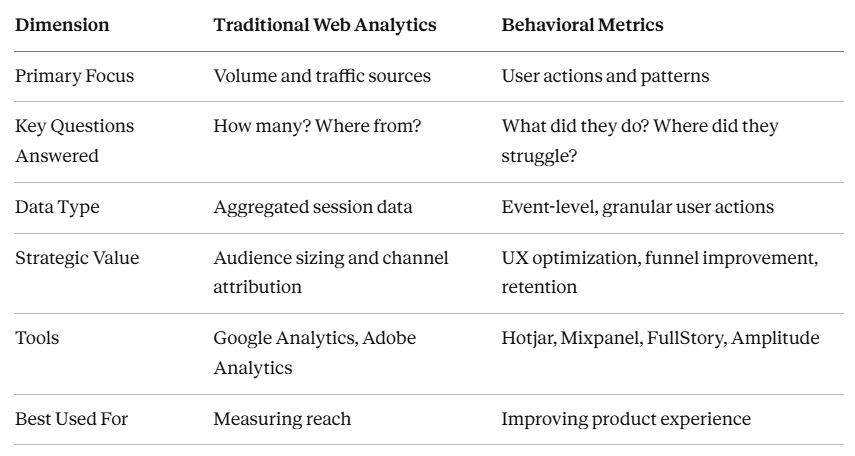
Behavioral Metrics vs. Traditional Web Analytics: A Comparison
Common Mistakes When Analyzing Behavioral Data
Tracking too many metrics without a clear framework. When every metric is a priority, none of them are. Start with five to seven core behavioral indicators tied to specific business outcomes.
Ignoring qualitative data alongside quantitative signals. Behavioral metrics tell you what is happening. User interviews and session recordings tell you why. Both are required for accurate diagnosis.
Drawing conclusions from statistically insignificant data. A 2% conversion rate improvement based on 200 users is not statistically reliable. Ensure your sample sizes are large enough before making product decisions.
Confusing correlation with causation. The fact that users who read three blog posts convert at higher rates does not mean reading three blog posts causes conversion. There may be a third variable: these users are simply more motivated. Test assumptions before acting on them.
Failing to segment behavioral data by user type. Aggregated behavioral metrics often hide meaningful differences between new and returning users, mobile and desktop users, or free and paid plan users. Always segment before drawing conclusions.
FAQ
What is the difference between behavioral metrics and engagement metrics?
Engagement metrics are a subset of behavioral metrics. Engagement metrics specifically measure the depth and quality of a user's interaction with content or product features (such as time on page, scroll depth, or interaction rate). Behavioral metrics is the broader category that includes engagement, conversion, retention, navigation, and flow data.
Which behavioral metrics should I track for a SaaS product?
For a SaaS product, prioritize: feature adoption rate, onboarding completion rate, DAU/MAU stickiness ratio, funnel drop-off rate at key steps, and 30/60/90-day retention cohorts. These directly reflect whether users are getting value from your product.
How do behavioral metrics improve conversion rates?
Behavioral metrics reveal the exact points where users hesitate, get confused, or abandon a conversion flow. By identifying these friction points through funnel analysis, heatmaps, and session recordings, teams can make targeted UX improvements that directly increase conversion rate.
What is the best free tool for website behavioral analytics?
Google Analytics 4 offers strong event-based behavioral tracking for free, including funnel exploration and user flow reports. Hotjar also offers a free tier that includes heatmaps and a limited number of session recordings, making it a strong complement for visual behavioral analysis.
How often should I review my behavioral metrics?
High-priority behavioral KPIs (like funnel conversion rate and activation rate) should be reviewed weekly. Broader engagement metrics can be reviewed bi-weekly or monthly. The key is consistency: behavioral trends emerge over time, and irregular review leads to missed signals.
Conclusion
Behavioral metrics are not just another layer of analytics. They are the strategic foundation for building digital products and content experiences that genuinely work.
Traffic tells you about reach. Behavioral data tells you about reality. And in a competitive digital environment, the teams that close the gap between those two things consistently win.
Start by defining the three to five behaviors that most directly predict success for your product or content. Instrument them carefully, review them consistently, and use what you find to inform decisions rather than justify them.
Whether you are optimizing an e-commerce checkout funnel, improving SaaS onboarding, or deepening content engagement, behavioral metrics give you the clearest possible picture of what your users actually need and exactly where you are falling short of delivering it.
The data is already there. The question is whether you are paying strategic attention to it.